The principles, methods, and results of air filtration applications in pharmaceutical and medical device manufacturing systems. In this sector, air filtration is a core element in ensuring product quality, safety, and regulatory compliance, far exceeding the importance of general industrial or residential environments.
Why Use Air Filtration?
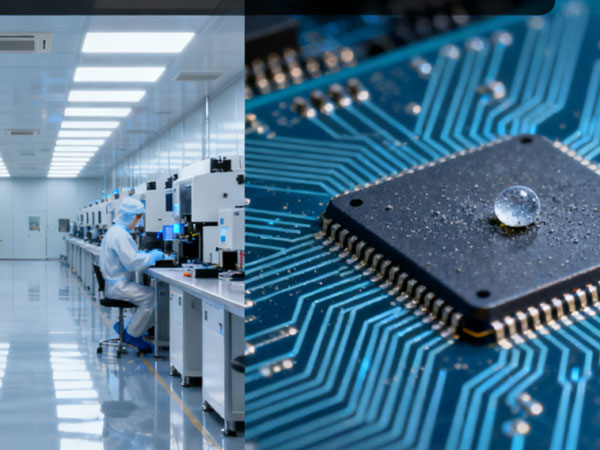
In pharmaceutical and medical device manufacturing, the core principle of air filtration systems is strict contamination control. The goal is to create and maintain a controlled environment that meets specific cleanliness levels to prevent product contamination from various airborne sources.
Specific principles and motivations include:
Preventing microbial contamination: This is a critical goal, especially in the production of sterile pharmaceuticals (such as injectables and eye drops) and implantable/sterile medical devices. Airborne microorganisms such as bacteria, fungal spores, and viruses can cause product failure, lead to patient infection, or even be life-threatening if they land on product or contact surfaces. Air filtration (particularly HEPA/ULPA grades) is the primary means of removing airborne microorganisms and their carriers (such as dust particles).
Preventing Particulate Contamination: Non-viable particles in the air, such as dust, fibers, metal shavings, and skin flakes, are also serious contaminants for pharmaceuticals (especially injectables, which can cause blood vessel blockage) and precision medical devices (which can affect performance or trigger foreign body reactions in the body). High-efficiency filtration can keep the number of airborne particles to extremely low levels.
Preventing Cross-Contamination: In workshops producing different types of pharmaceuticals or active ingredients, air filtration helps coordinate airflow design to prevent powder or active ingredients from previous batches from spreading through the air and contaminating subsequent products.
II. How is Air Filtration Implemented?
Air filtration in pharmaceutical and medical device production is a complex and sophisticated systems engineering process, primarily manifesting in the following aspects:
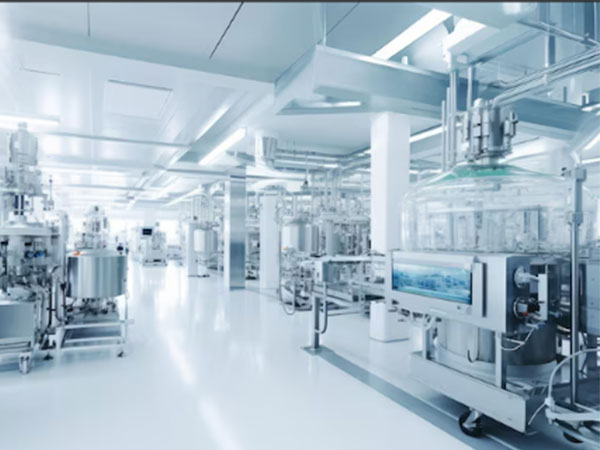
Cleanroom HVAC System:
Core Support: Air filtration functions are primarily integrated into HVAC systems designed specifically for cleanrooms.
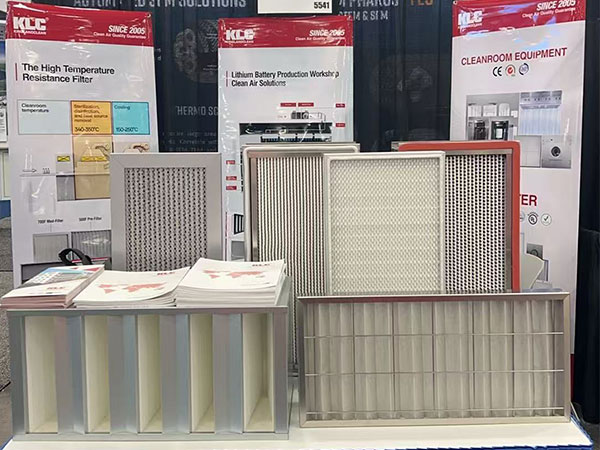
Multi-stage Filtration Strategy: Air handling units (AHUs) typically have multiple stages of filtration:
Pre-filter: Typically rated G4/MERV 8/ISO Coarse, removes large particles and protects the medium-efficiency filter.
Medium/High-Medium Filter: Typically rated F7-F9/MERV 13-15/ePM1, ePM2.5, further purifies the air and reduces the burden on the final HEPA filter.
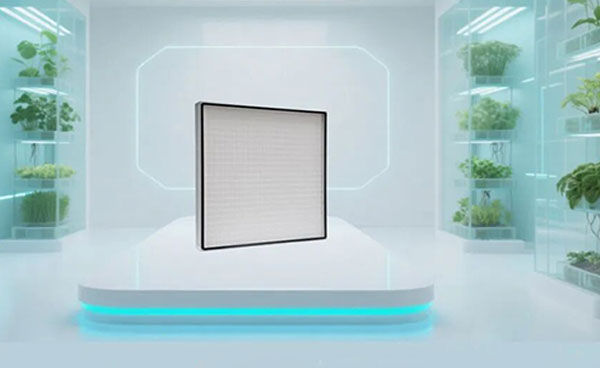
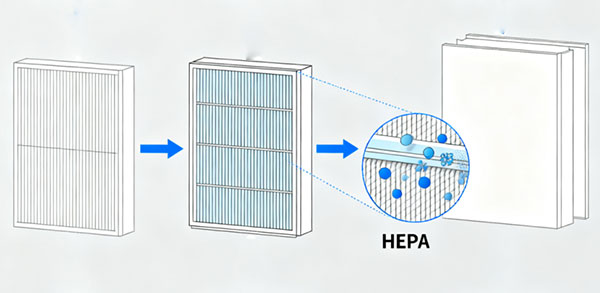
Terminal Filtration: This is the most critical step in ensuring cleanroom quality. These filters are installed at the very end of the air supply system, directly supplying air into the cleanroom.
Filter Type: HEPA (High-Efficiency Particulate Air) filters (H13, H14) or ULPA (Ultra-Low Penetration Air) filters (U15 or higher) are commonly used. The specific cleanliness level to choose depends on the required cleanliness level of the area (for example, an ISO 8/GMP Grade D area might use H13, an ISO 7/GMP Grade C area uses H14, and an ISO 5/GMP Grade A/B core area must use H14 or higher, combined with unidirectional airflow).
Installation Type:
High-efficiency air inlets: HEPA/ULPA filters are installed in a custom-designed air inlet housing, with air delivered through diffusers (often used in areas with non-unidirectional airflow).
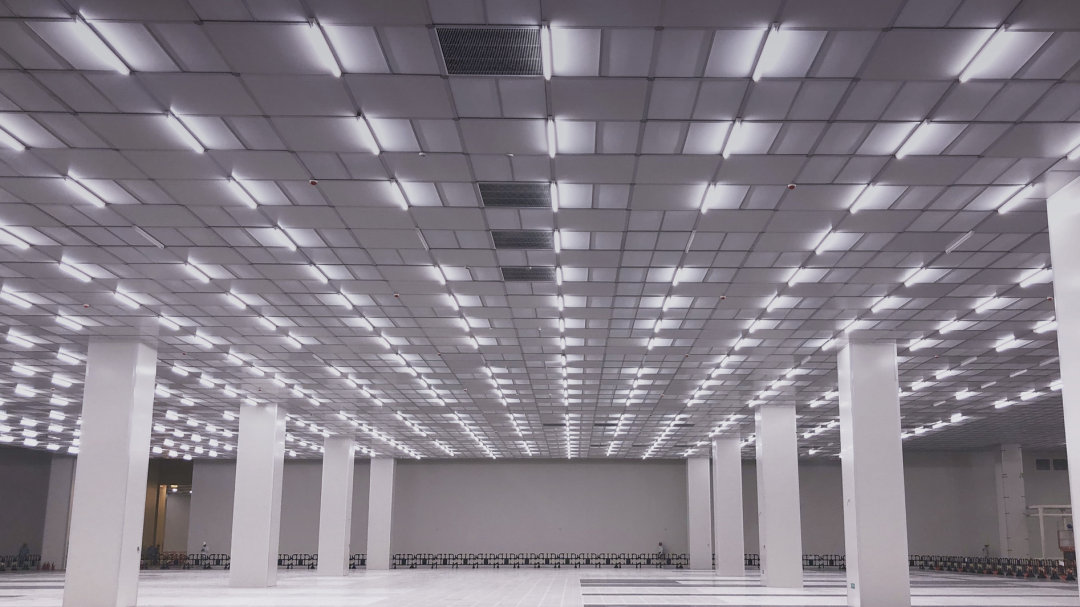
Fan filter units (FFUs): Fans and HEPA/ULPA filters are integrated into a modular unit. These units are densely mounted in the ceiling to create vertical, unidirectional (laminar) airflow over a large area. They are the primary method for achieving an ISO 5/GMP Grade A environment.
Airflow pattern: This works closely with filtration to control the direction of air flow to remove contaminants.
Unidirectional Flow (Laminar Flow): In critical operating areas (such as aseptic filling and areas directly exposed to product, corresponding to GMP Grade A), HEPA/ULPA-filtered air flows through the work area in uniform, parallel streams (typically vertically downward) at a specific velocity (e.g., 0.36-0.54 m/s). This quickly "blows away" generated particles and prevents them from settling above the product or on critical surfaces.
Non-Unidirectional Flow (Turbulent Flow): In areas with lower cleanliness requirements (such as GMP Grades C and D), filtered air is introduced through supply vents, mixed with room air to dilute contaminants, and exhausted through return vents. Maintaining cleanliness relies on a sufficiently high air changes per hour (ACH).
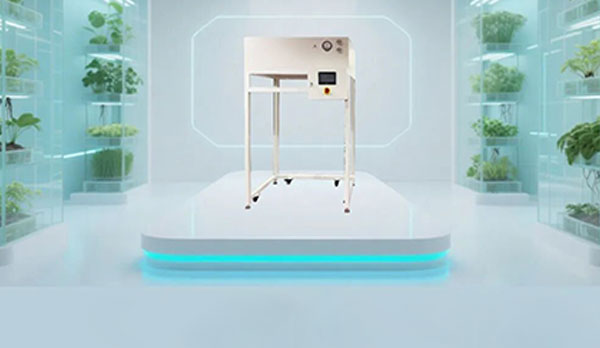
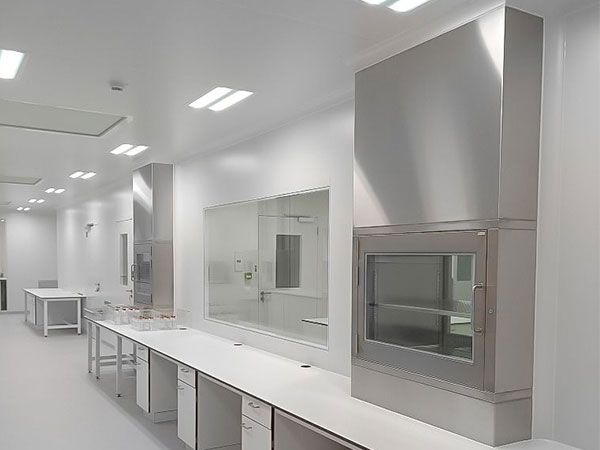
Localized Protection & Containment Systems:
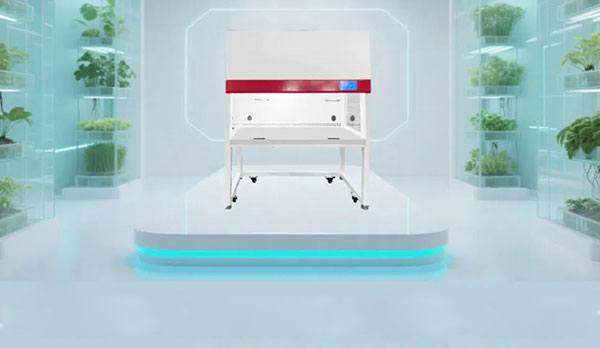
Laminar Flow Hoods / Biological Safety Cabinets (BSCs): These provide a small, unidirectional, clean environment to protect products or personnel.
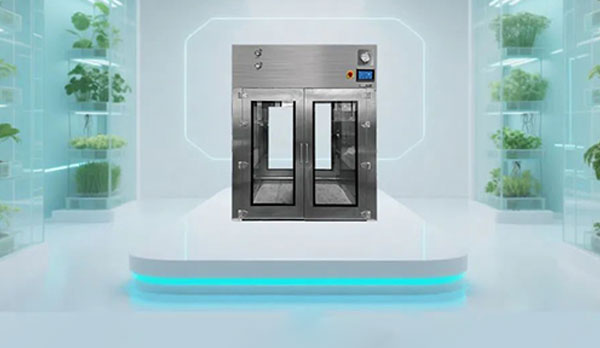
Isolators / Restricted Access Barrier Systems (RABS): These provide highly enclosed physical barriers, maintaining a GMP Grade A environment and separating personnel from the core aseptic processing area. They are a key technology in modern aseptic production, relying on HEPA/ULPA filtration for both internal air circulation and exchange with the external environment.
Exhaust Air Filtration: For operating rooms or equipment generating hazardous dusts (such as highly active pharmaceutical powders), aerosols, or biohazardous materials, exhaust air must be filtered through HEPA filtration (sometimes even two stages of HEPA) before discharge to protect personnel and the environment. A bag-in/bag-out (BIBO) filter replacement system is often used to ensure that operators do not come into contact with contaminated filters when replacing used filters.
III. Application Outcomes (What are the Outcomes?)
The successful application of air filtration systems in the pharmaceutical and medical device sectors is crucial:
Major Pros (Pros):
Ensuring Product Safety and Quality: Minimizing the risk of microbial and particulate contamination ensures the safety and effectiveness of finished drugs and medical devices, which is directly related to patient health and life.
Meeting Regulatory Compliance: This is a prerequisite for companies to obtain production licenses and market their products. Compliance with standards such as GMP and ISO 14644 is mandatory. Failure to comply can result in serious consequences such as warning letters, product recalls, production suspension, and even license revocation.
Improving Production Reliability and Consistency: A stable, clean production environment reduces process fluctuations and deviations caused by environmental factors, helping to ensure consistent quality between product batches.
Reduce Batch Rejection Due to Contamination: Effective contamination control significantly reduces the risk of products failing quality inspection due to microbial or particulate contamination, thereby mitigating significant economic losses.
Ensure Operator Safety: Exhaust air filtration and isolation technologies protect employee health in processes handling highly active or toxic substances.
Improve Corporate Reputation and Market Competitiveness: Strict adherence to high-standard production practices is the cornerstone of the credibility of pharmaceutical and medical device companies.
Summary:
Air filtration plays an absolutely core role in pharmaceutical and medical device manufacturing. It is a cornerstone technology for ensuring product sterility and the absence of particulate contamination, thereby safeguarding patient safety and meeting regulatory requirements. Its application is highly systematic and sophisticated, closely integrated with HVAC systems, air flow management, and isolation technologies. While costly and maintenance-intensive, the resulting product safety, regulatory compliance, and production reliability are fundamental to the survival and growth of this industry.